


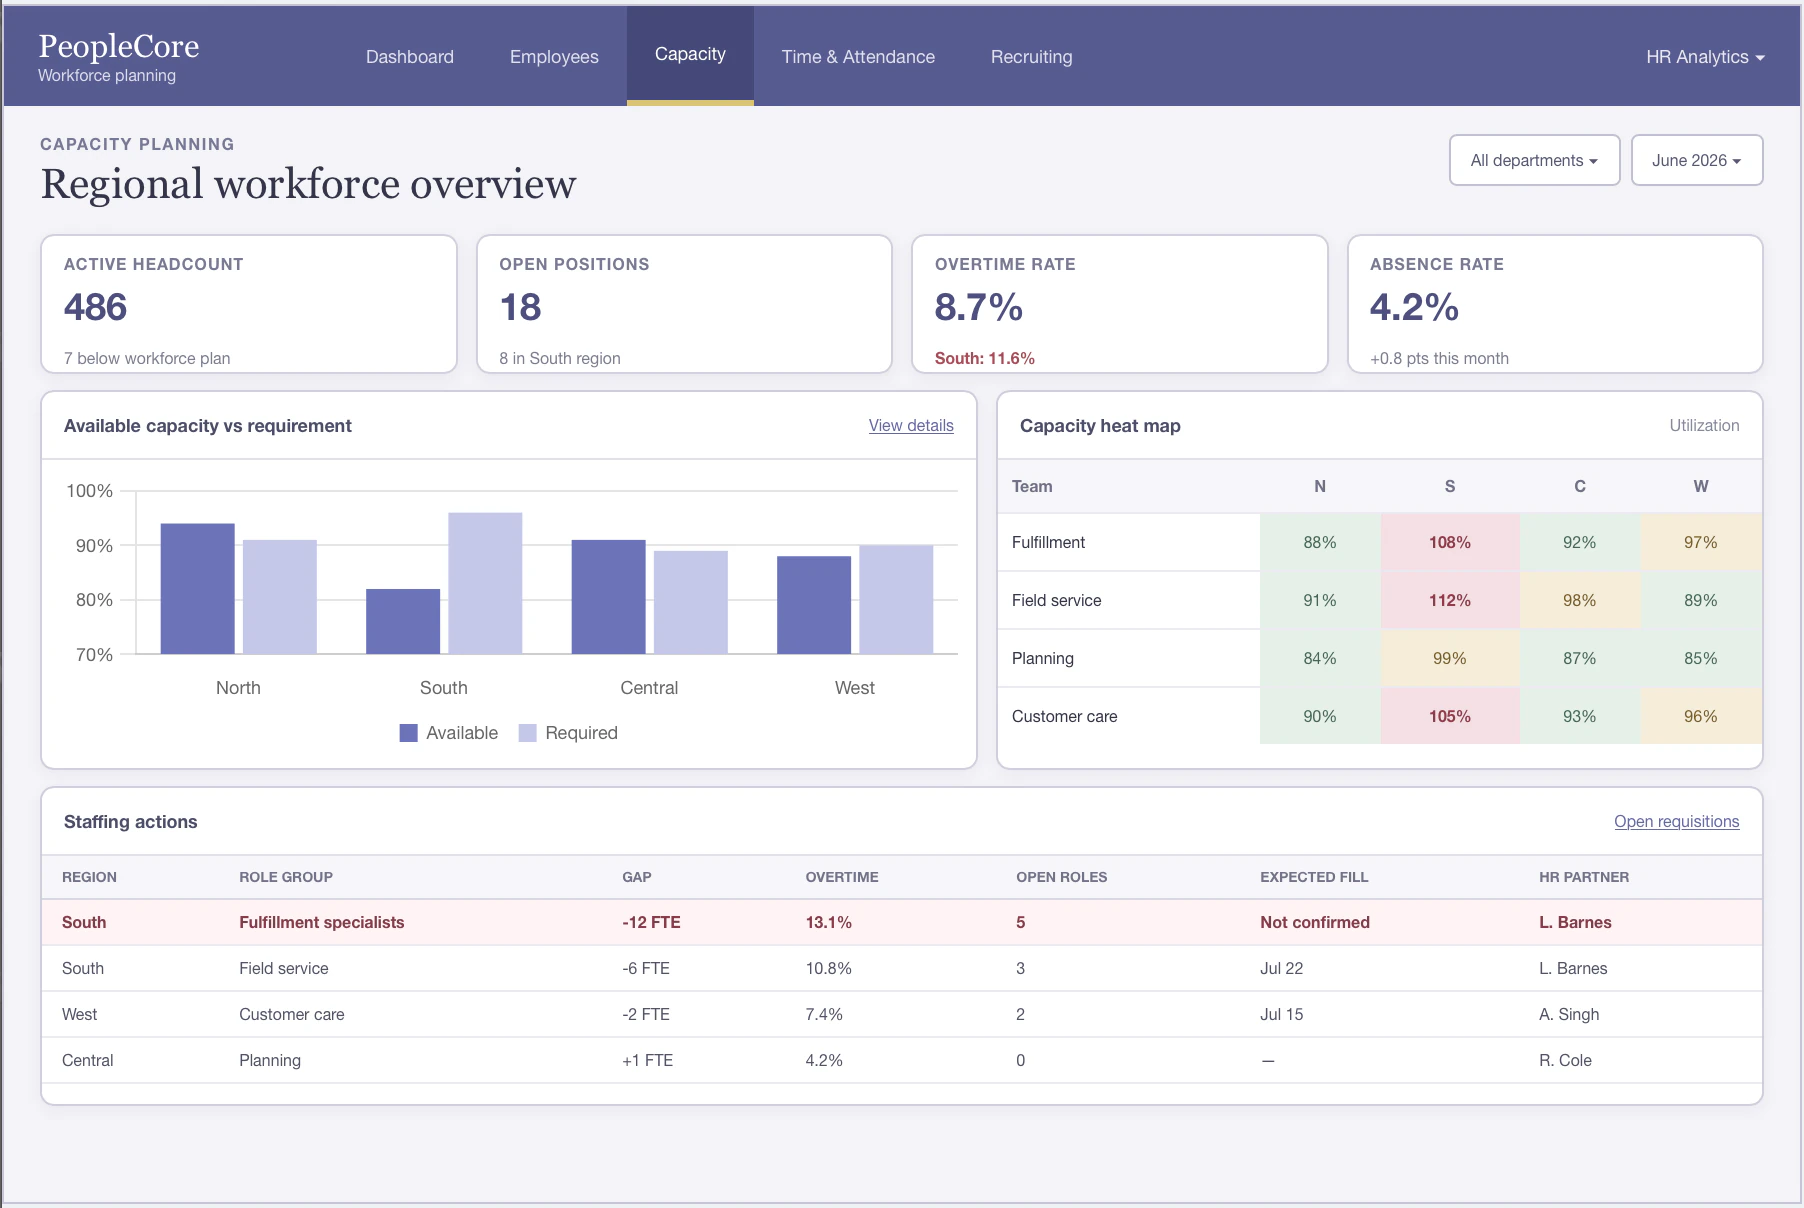
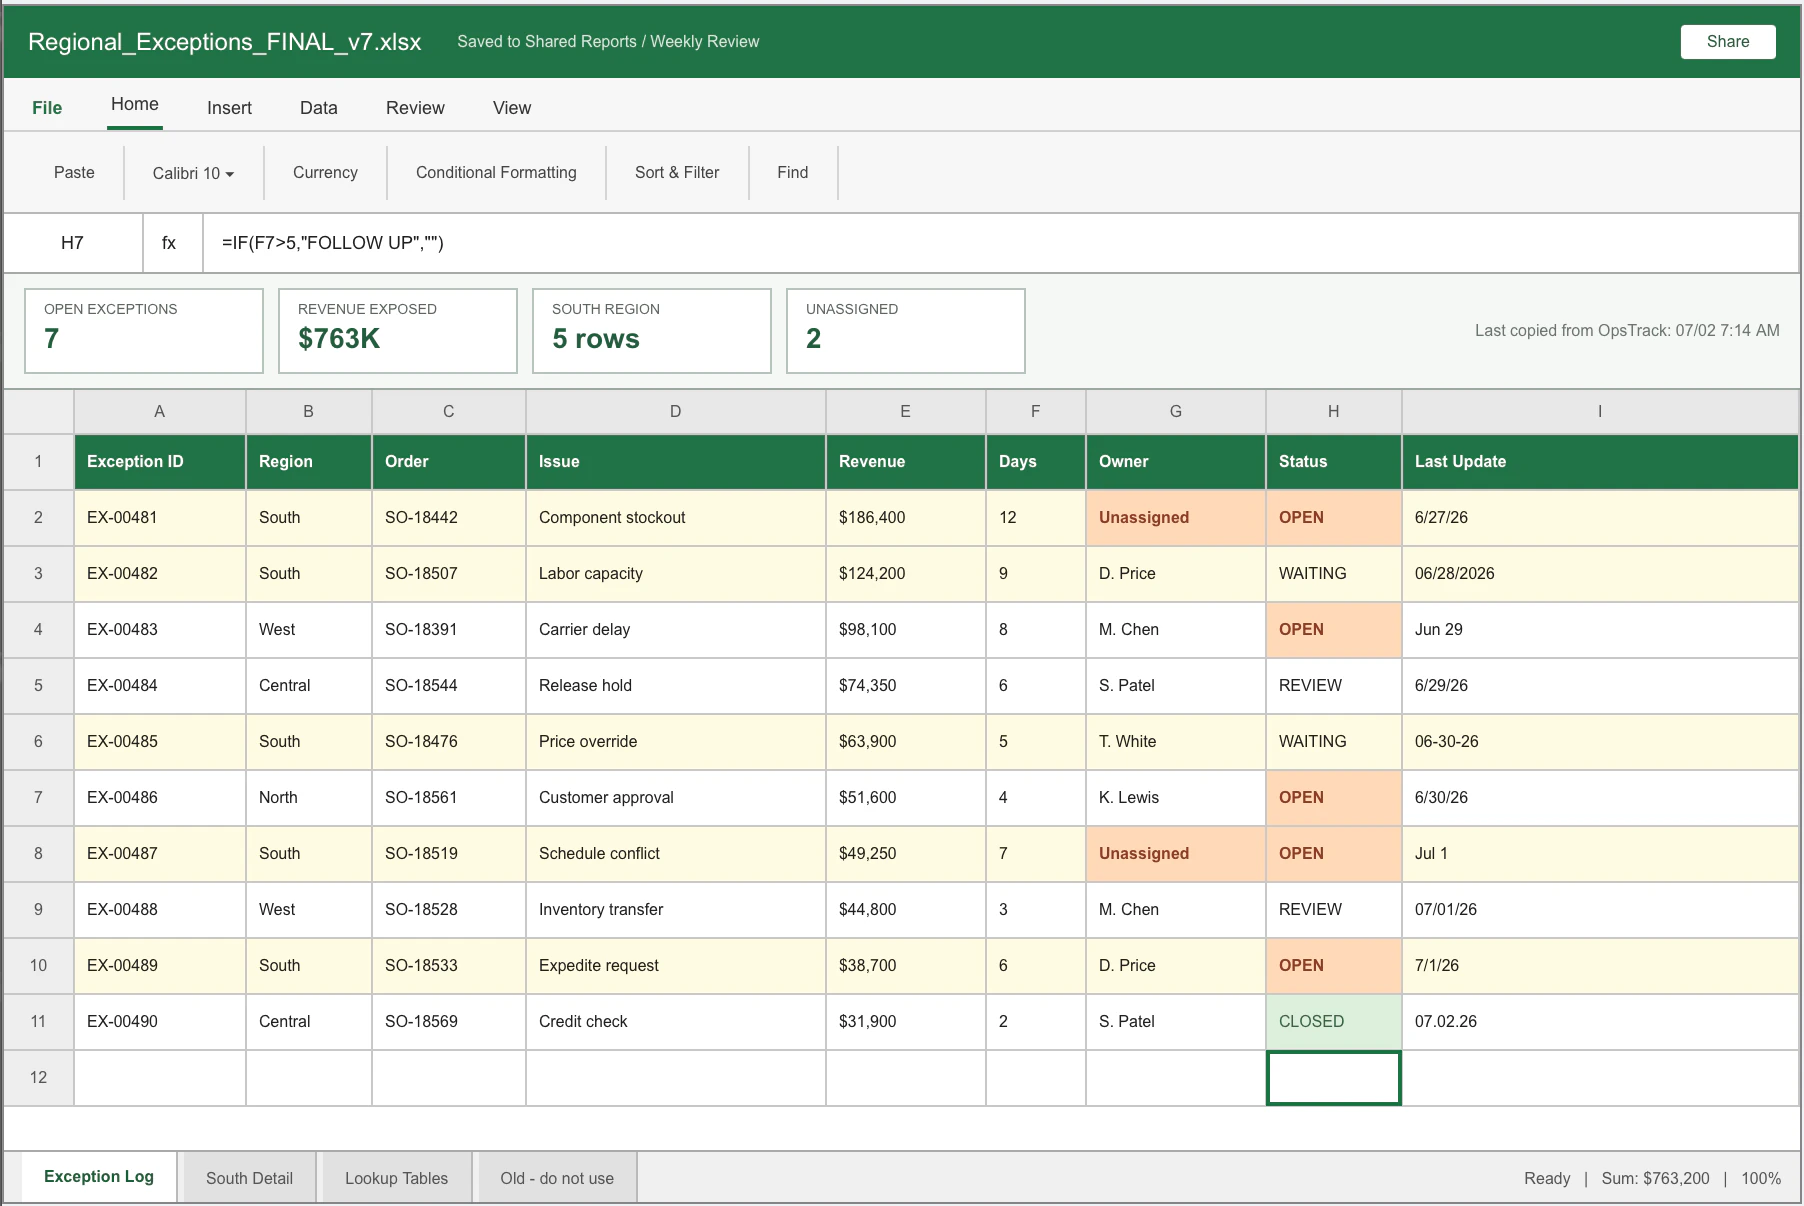
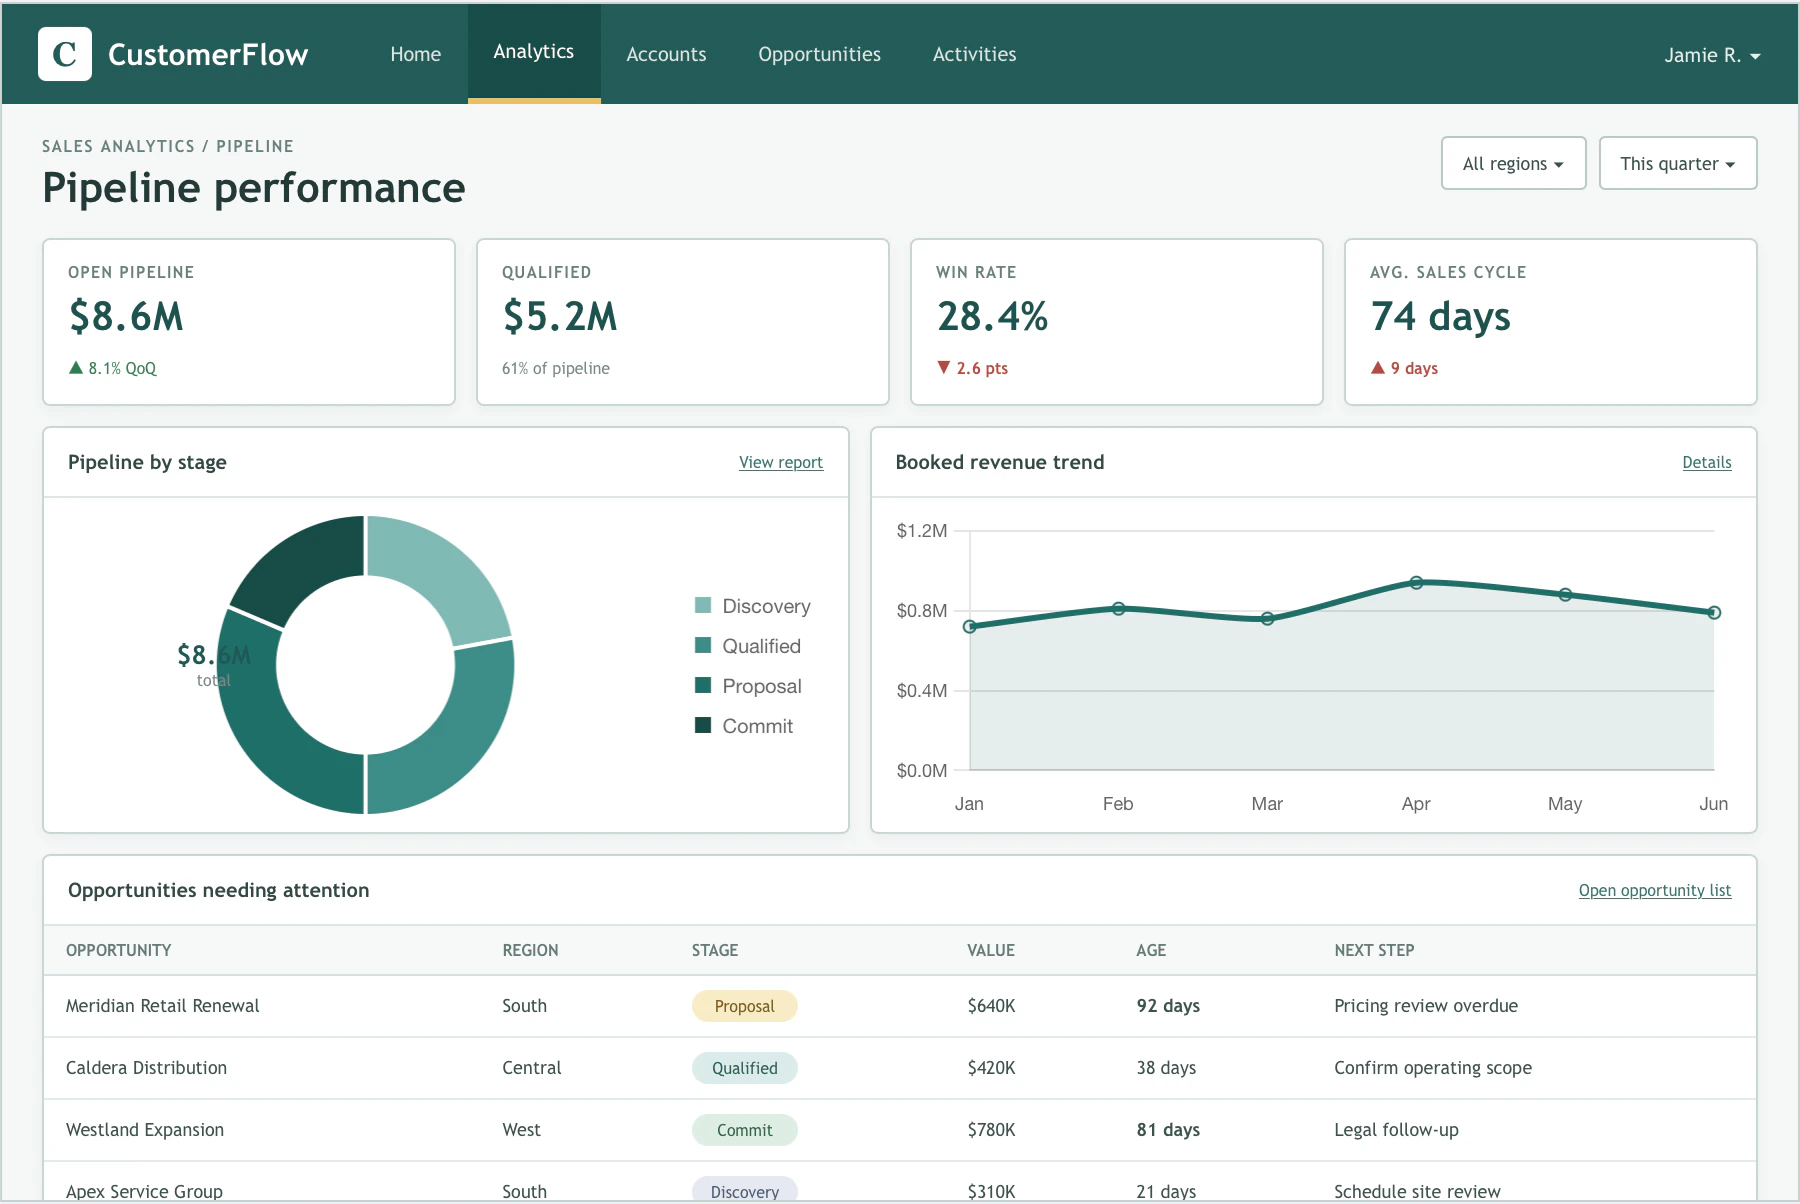
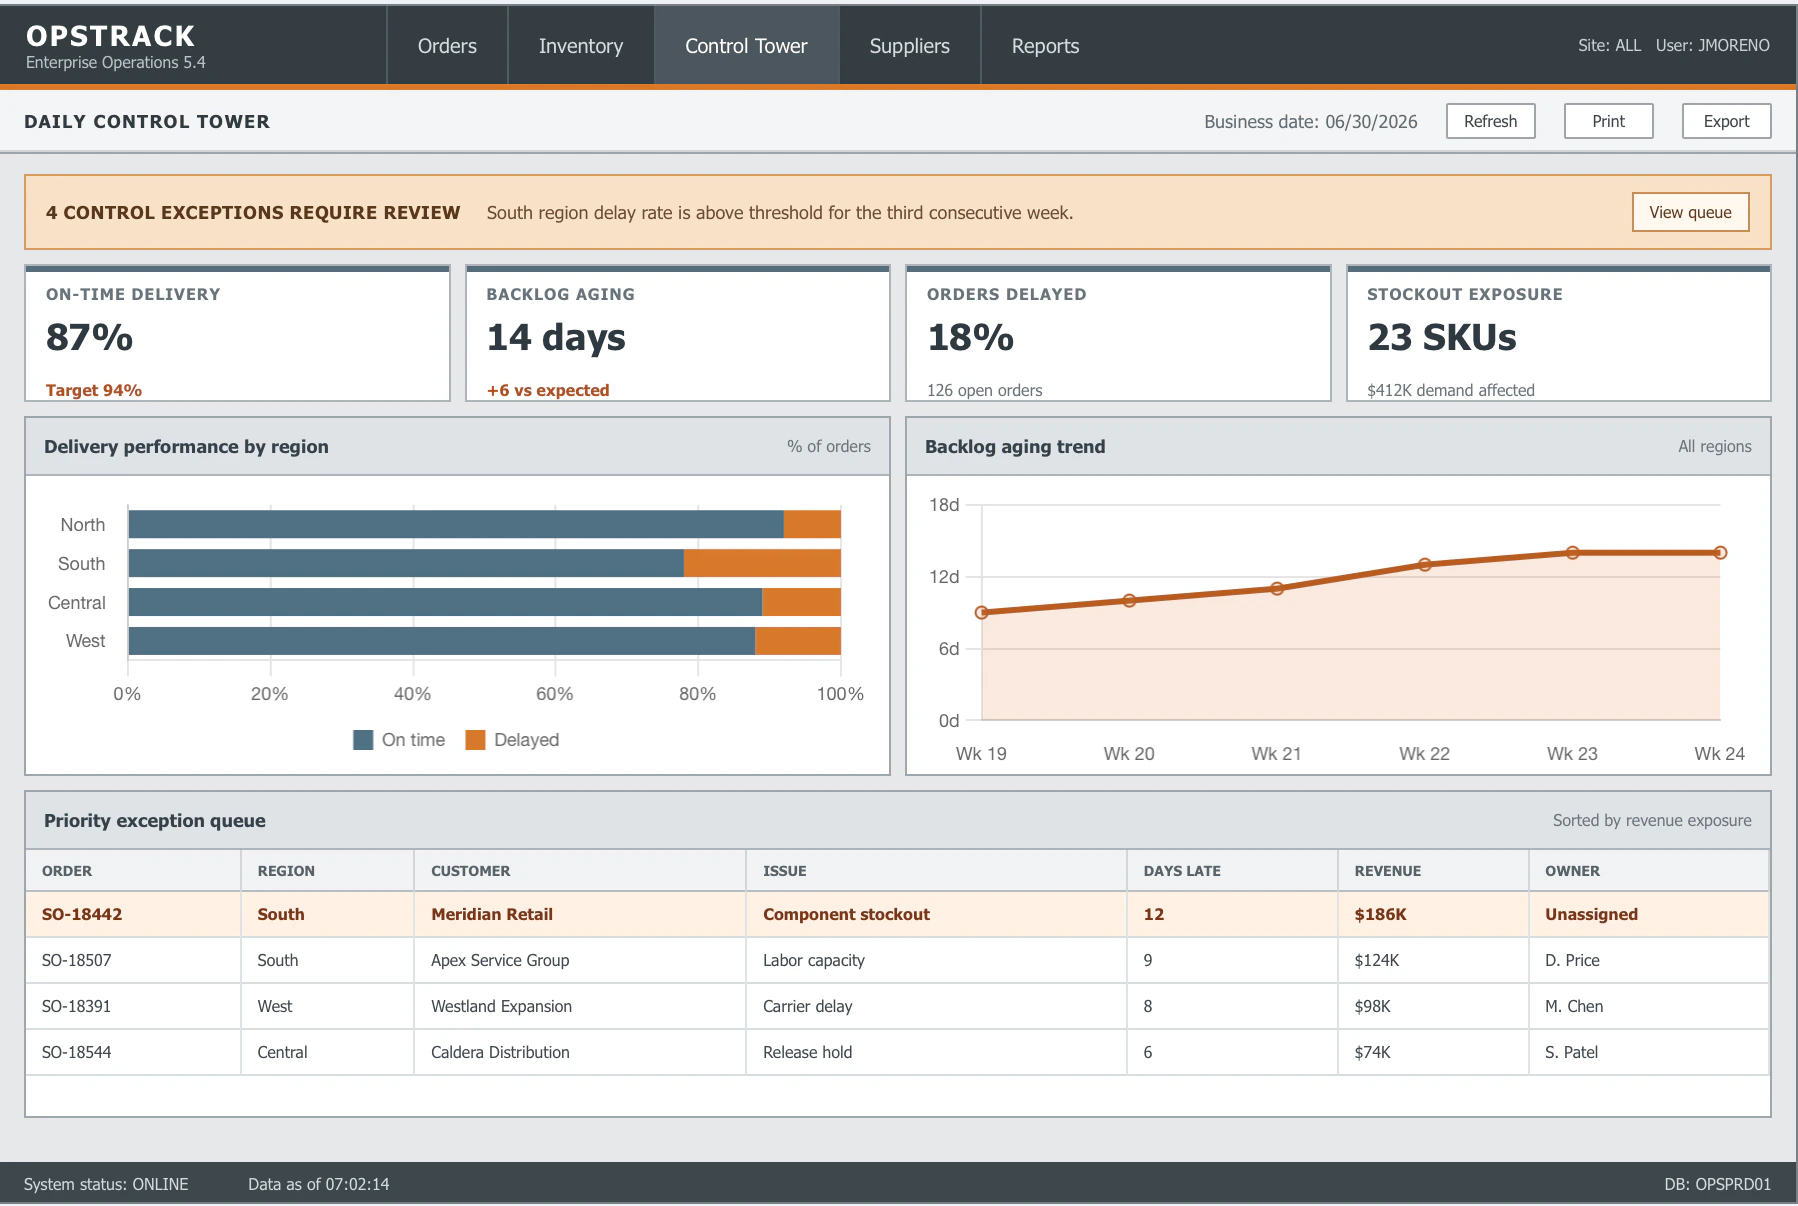
Fragmented sources
The answer sits across systems, exports, and side conversations.

 Scattered numbers
 Manual follow-up
 No ready picture

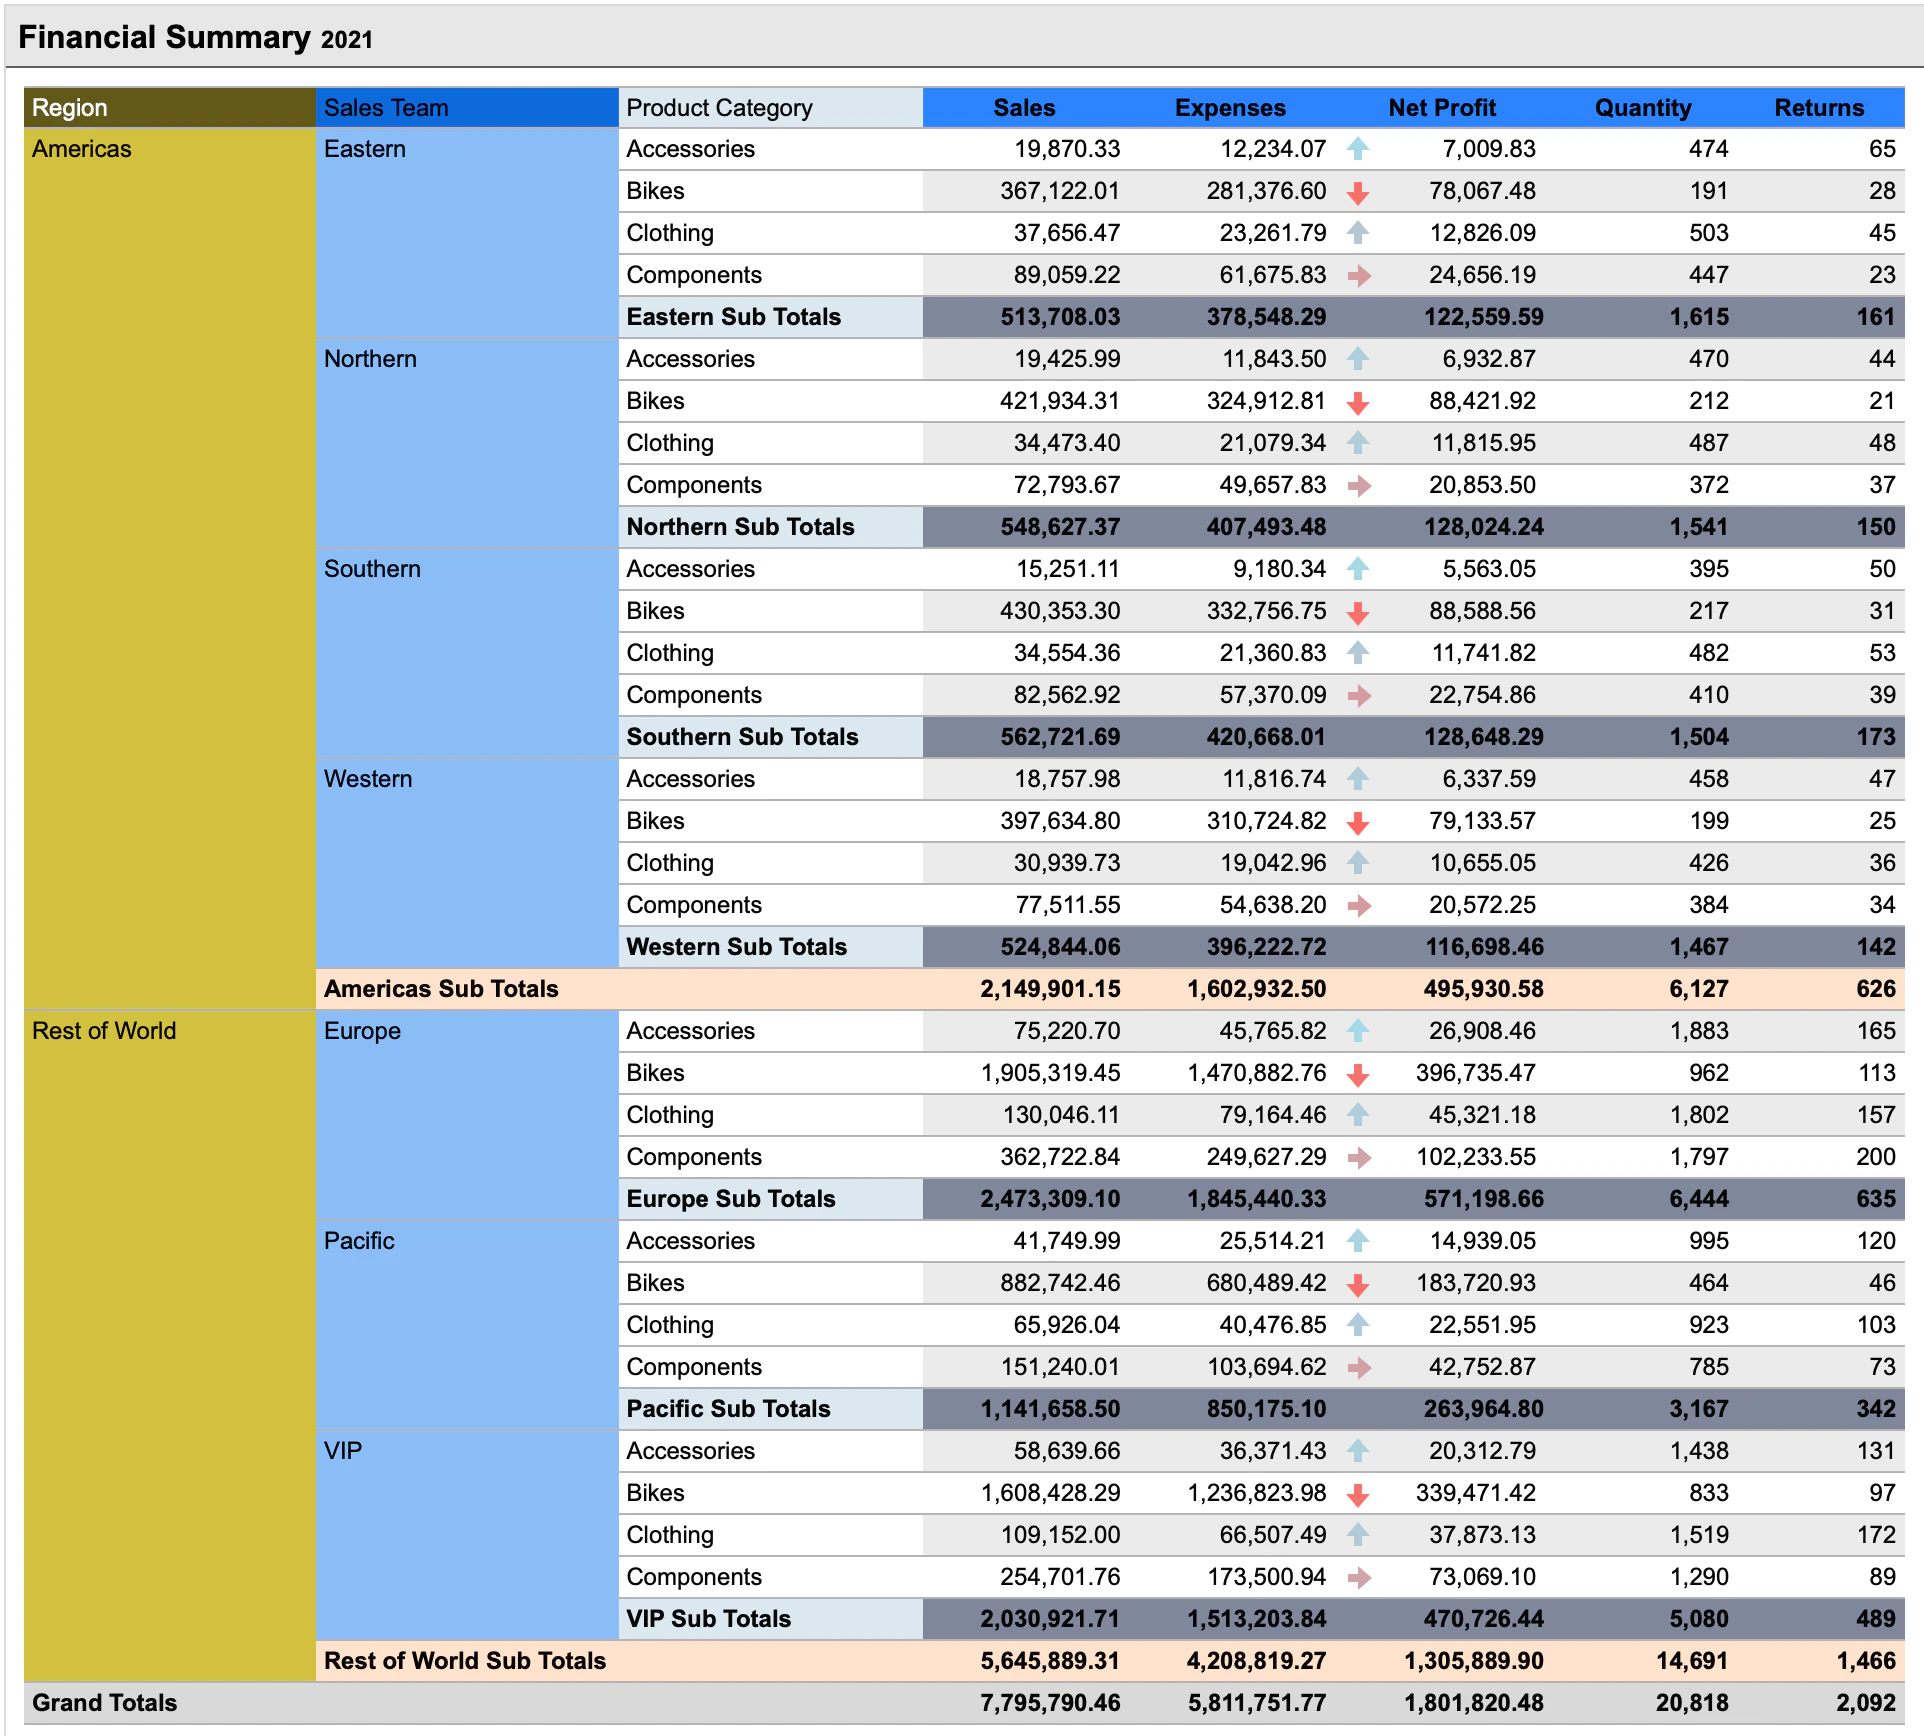
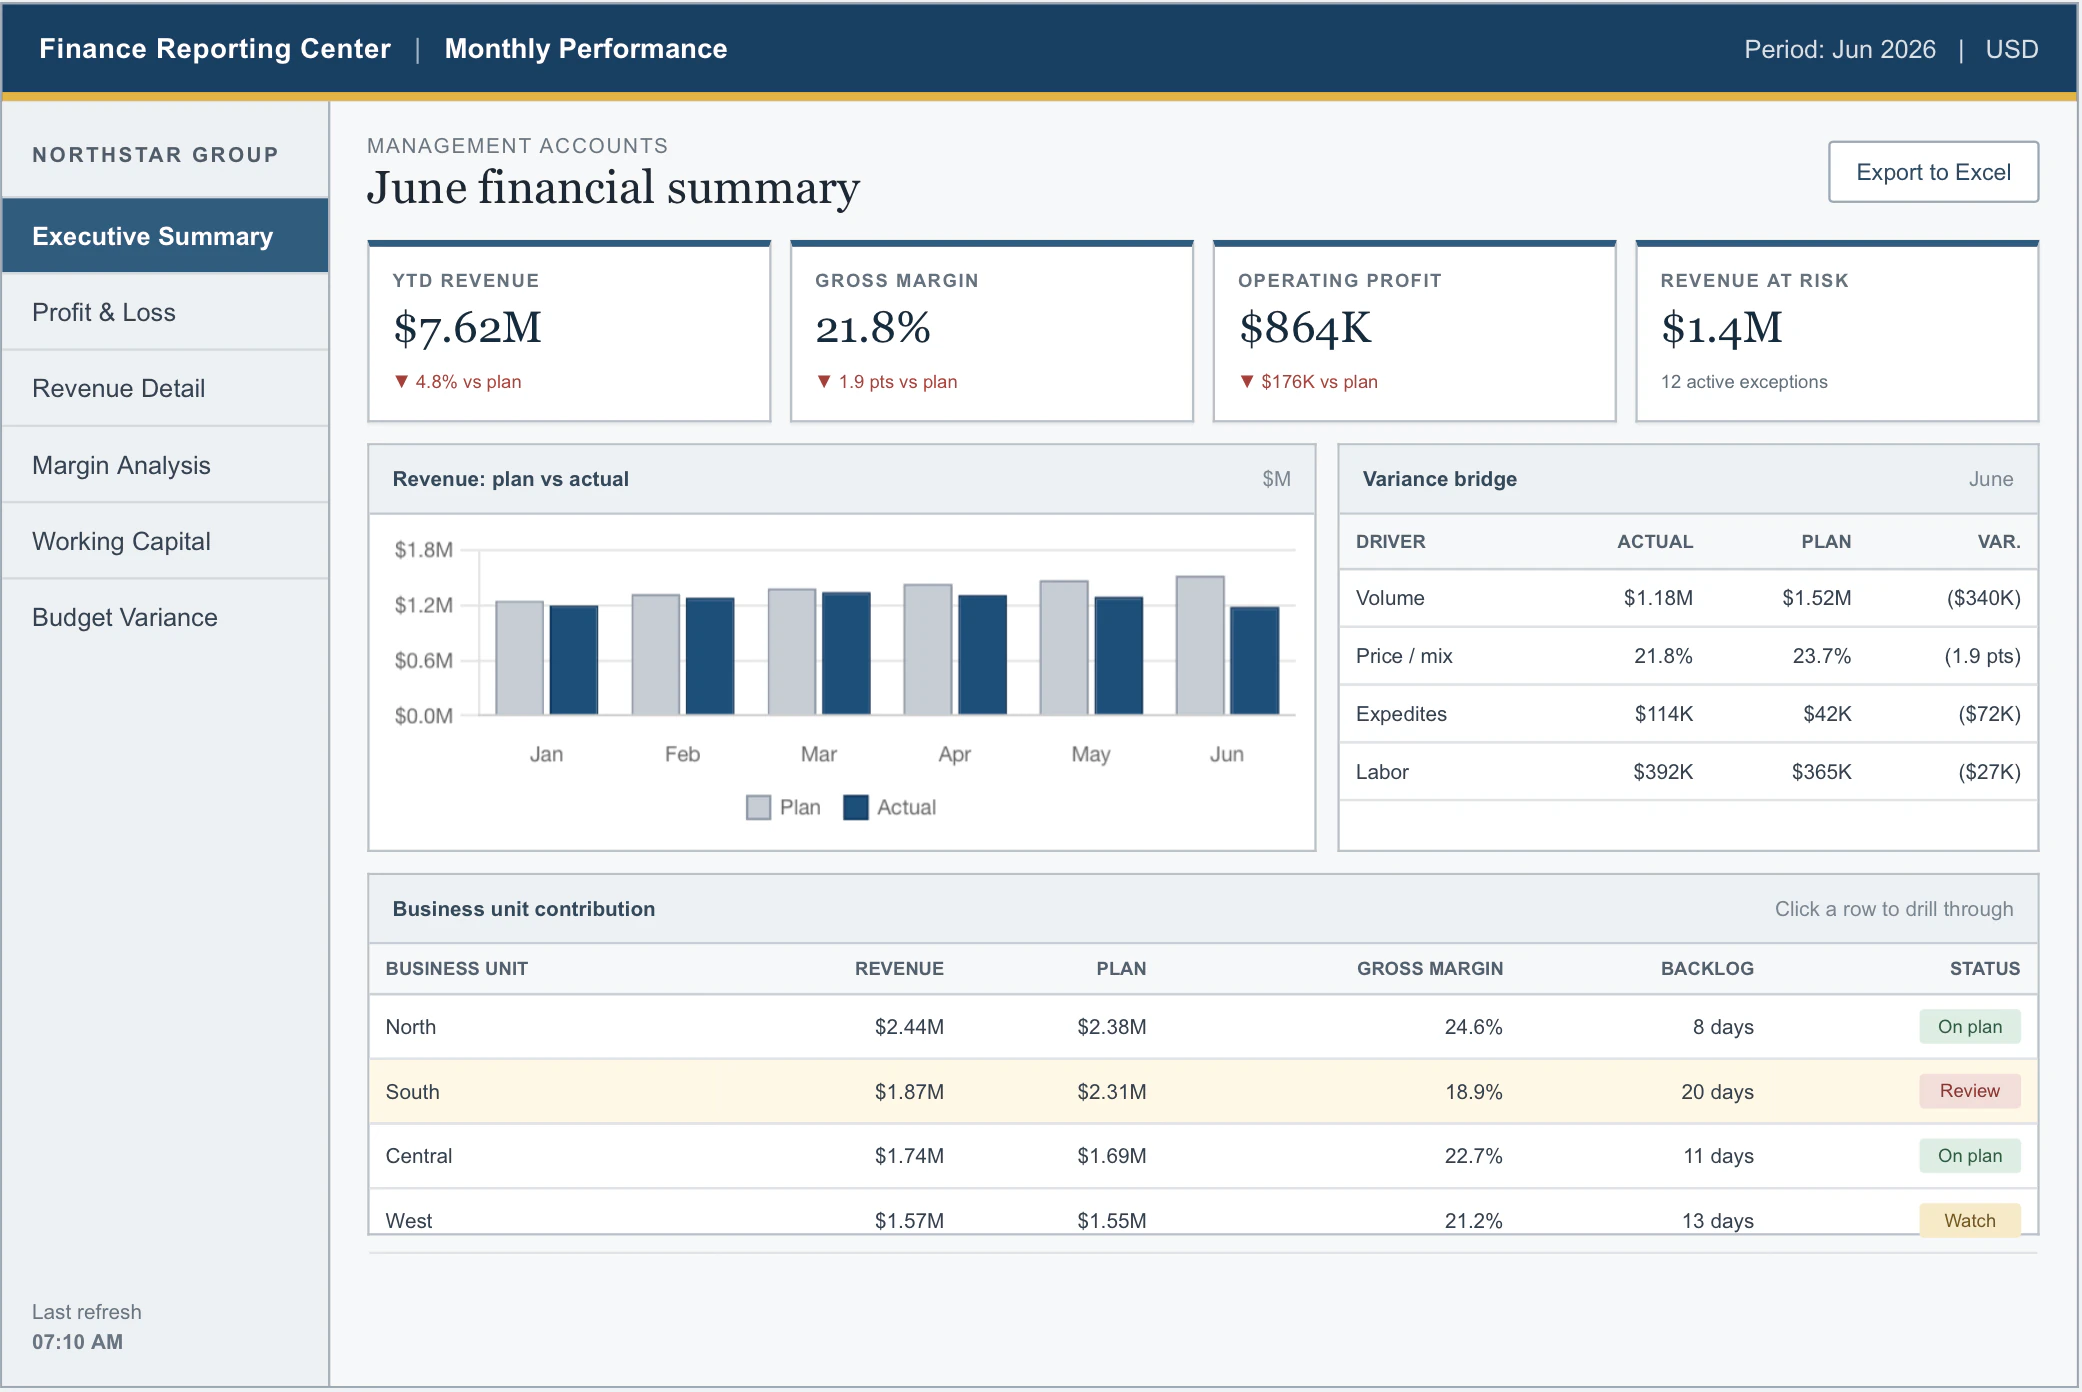
What slows decisions down
The answer sits across systems, exports, and side conversations.
Someone still has to piece the picture together before it becomes usable.
By the time the picture is clear, the business is already reacting late.
A managed answer layer for finished views, dashboards, reports, and decision pages.
Not more tooling. A clearer picture and a faster next move.

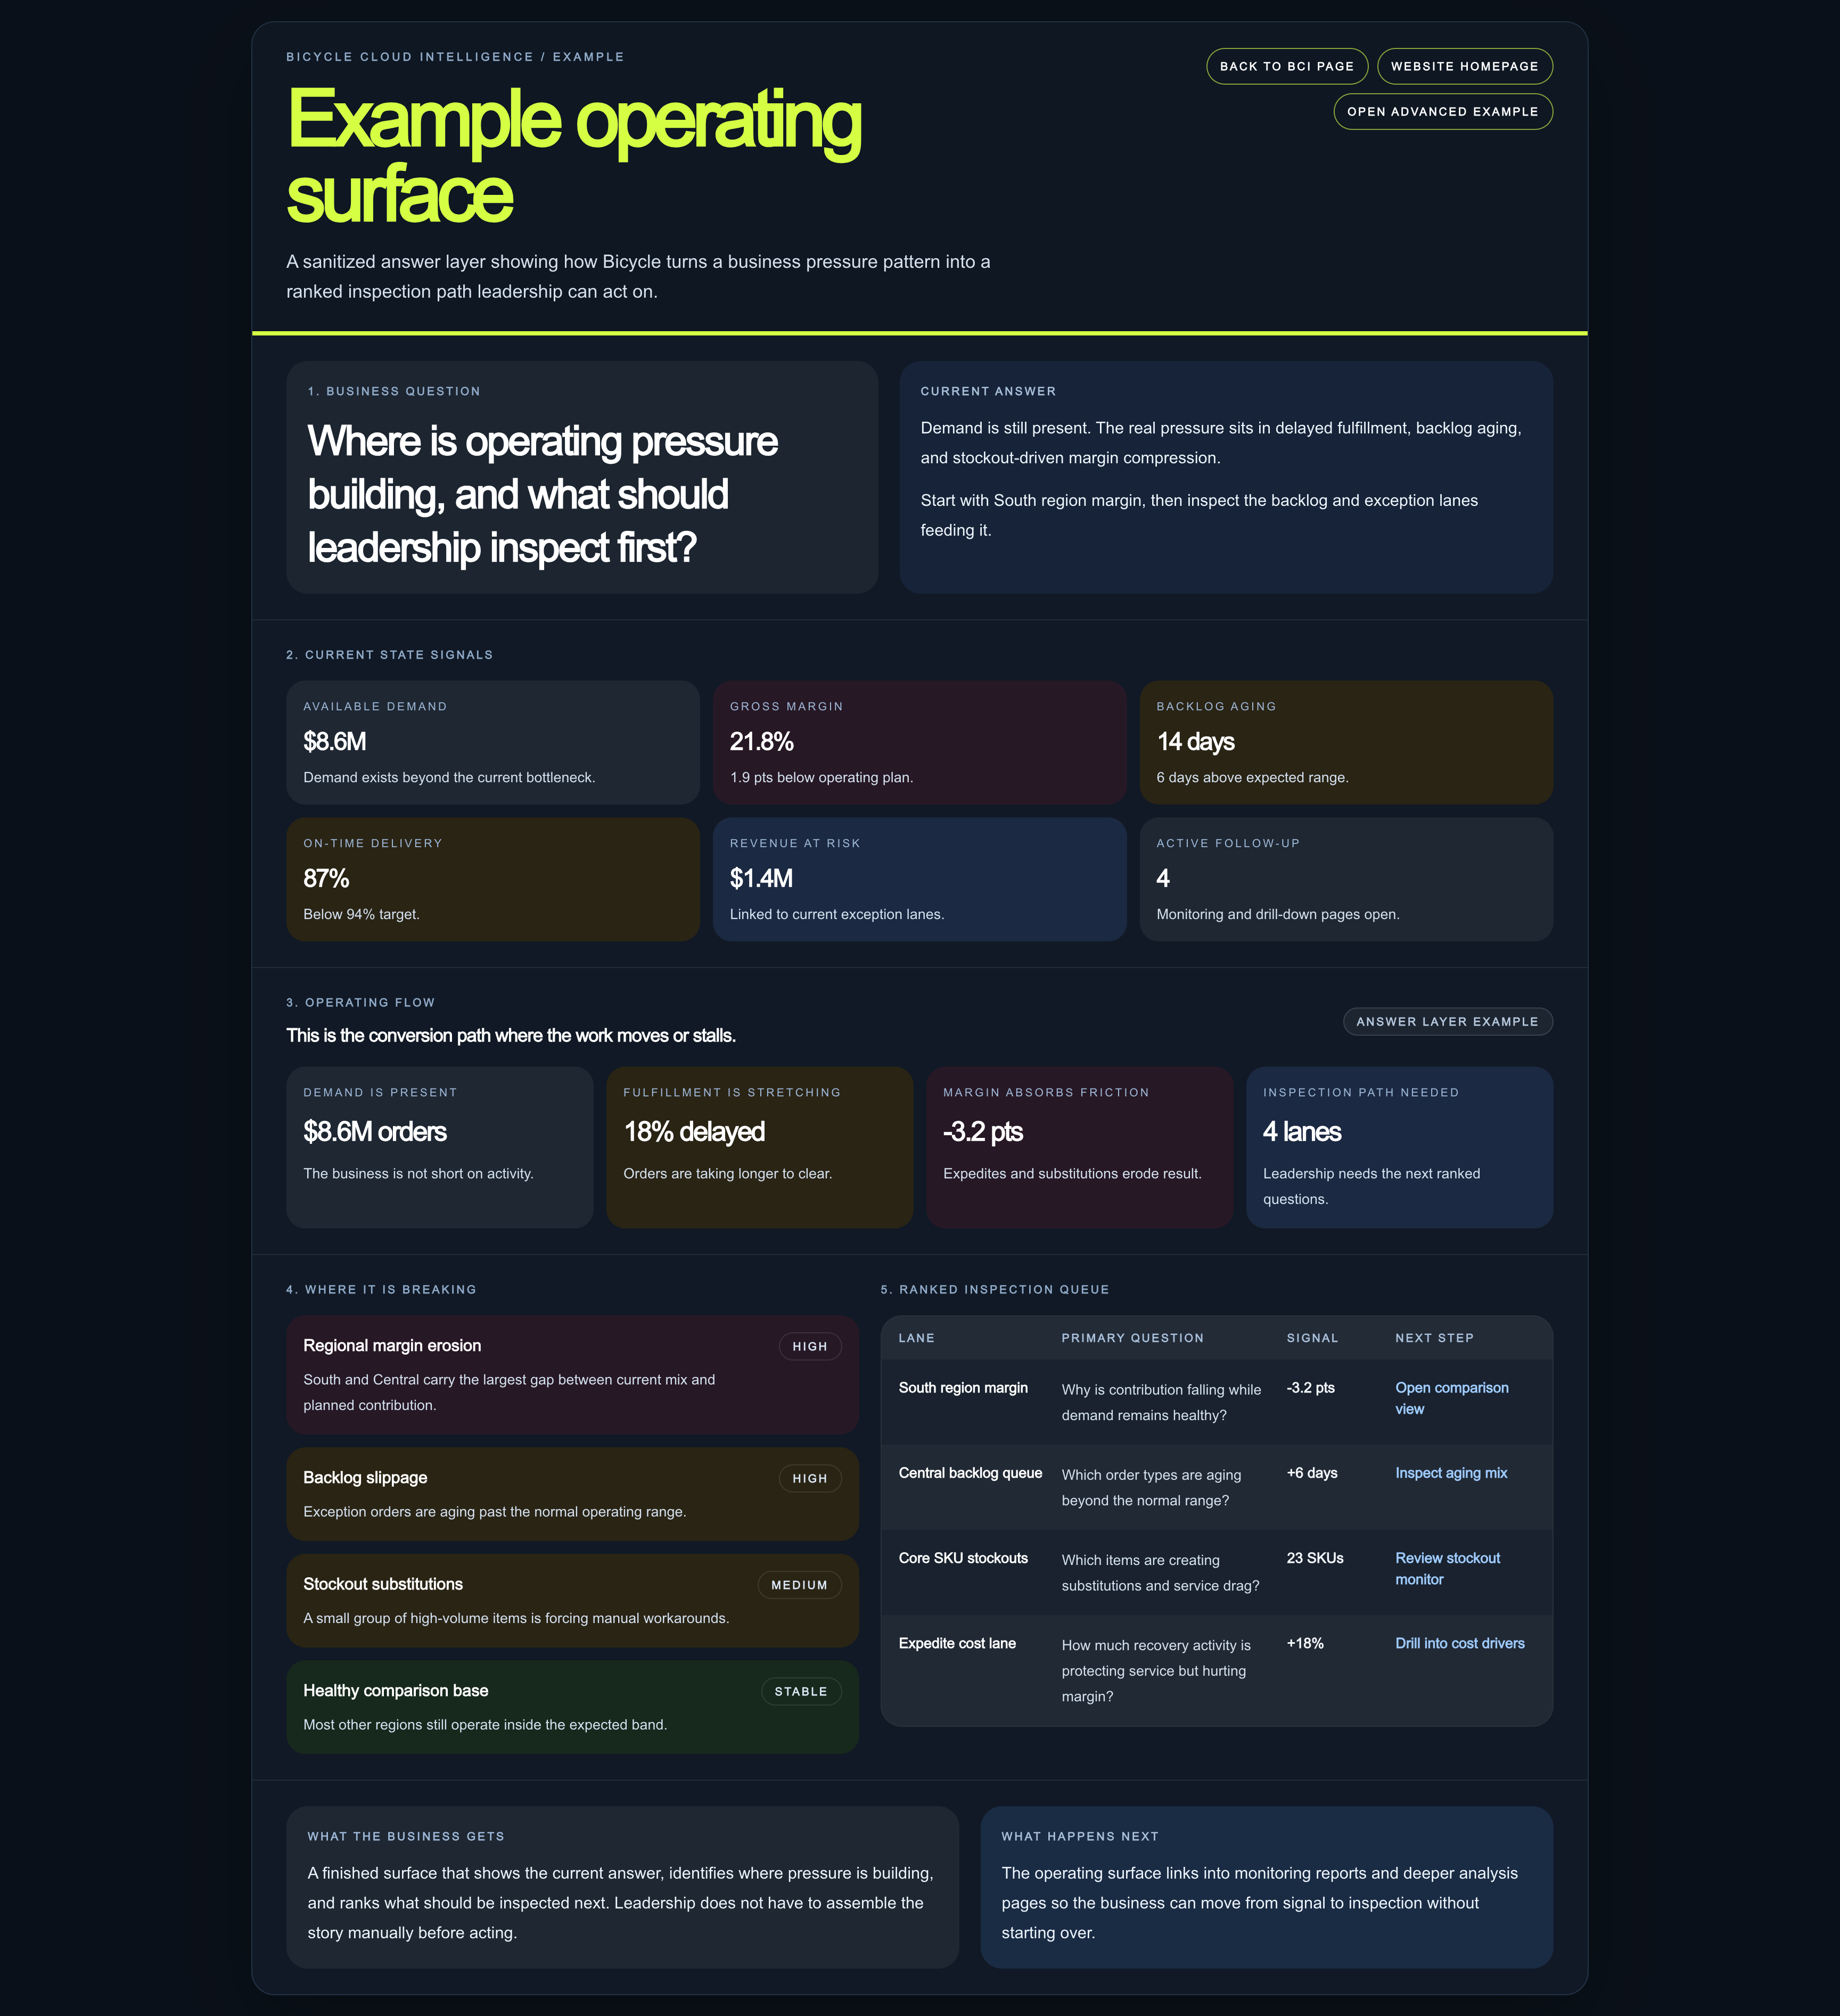

Start with the business question that needs a clearer answer now.
01.Define the view, report, or page that should exist.
02.Bring in the sources needed to make that answer work.
03.Improve it quickly, then carry the next question forward.
04.If the picture is fragmented, start with the reporting or
data-flow bottleneck causing the biggest decision delays.